Opportunity or threat? Business lessons from the Chinese blueberry boom
Between 2023 and 2025, China increased its exports of fresh blueberries from 1.011 tons to 7.098 tons. This leap is not only quantitative, but also reveals a temporal and geographical reconfiguration of supply.
The traditional March–June season remains the core of production, but 2025 shows early peaks in January–February, late rebounds in September, and sustained activity in the last quarter. At the same time, the diversification of destinations—with notable growth in Hong Kong, Malaysia, Singapore, Russia, Kyrgyzstan, Indonesia, and Vietnam—is transforming the region's commercial and logistical landscape.
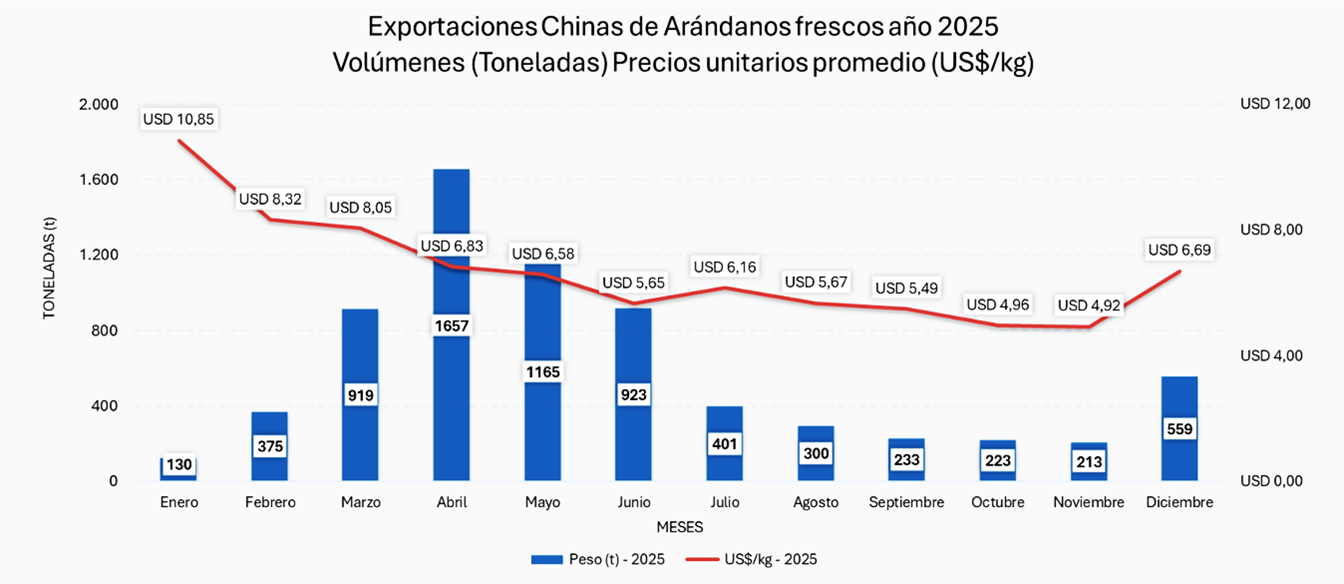

In 2025, the main destinations that concentrated the growth were Hong Kong 2.395 t, Malaysia 1.128 t and Singapore 928 t. Some emerging markets showed structural leaps such as Kyrgyzstan which went from not appearing in 2023 to a volume of 706 t in 2025, while Vietnam climbed from 57 t in 2024 to 182 t in 2025.
Russia, for its part, recorded 868 tons in 2025, with a one-off episode of high demand in September that partly explains the late increase in the curve.
These movements indicate two simultaneous phenomena: on the one hand, China's capacity to supply regional hubs with increasing volumes; and on the other, the opening of routes and agreements that allow previously marginal destinations to now absorb significant volumes. For buyers and distributors, this means greater supply and alternative sales windows; for external competitors, it implies price pressure and a need for differentiation.

Productive windows and extended seasonality
Monthly data from 2023–2025 show that the main window remains March–June, but 2025 exhibits extended seasonality. The months with the highest volume in 2025 were: April (1.657 t), March (919 t), May (1.165 t), and June (923 t). However, significant increases were seen in January (130 t) and February (375 t), and an atypical jump in September (233 t). December also showed significant activity (559 t), suggesting that Chinese supply now covers periods of the year that were previously in deficit in the region.
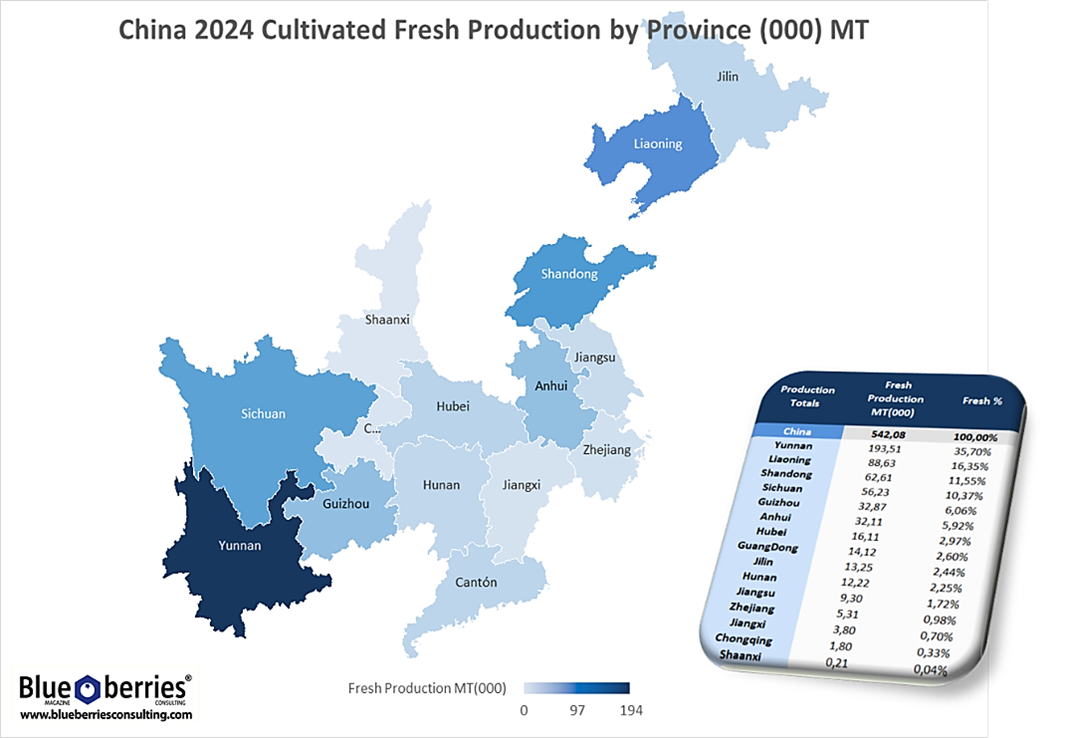
The technical explanation lies in the coexistence of production bases with different calendars: subtropical provinces like Yunnan, Guizhou, and Sichuan offer their produce earlier, while temperate northeastern provinces like Liaoning and Shandong maintain a later harvest. This combination allows China to "moderate" its season and offer fruit during periods that previously depended on other hemispheres.
Source: IBO Report 2025, Adapted by Blueberries Consulting
The value added for the 2025 campaign reflects the heterogeneity of markets. The total value added declared for 2025 amounts to US$50.823,24 thousand, with an approximate weighted average unit price of US$7,16/kg. However, prices vary widely by destination: Indonesia (US$12,16/kg) and Thailand (US$10,26/kg) register the highest unit values, while Macau (US$1,12/kg) and Kyrgyzstan (US$1,93/kg) show very low prices. This dispersion suggests differences in quality, presentation, trade channels (re-export or wholesale sales), and local bargaining power.
Total volume: 7.098 t
Total value: 50.823,24 thousand USD
Weighted average unit price: ≈ US$7,16/kg
The extended season and diversified destinations present both logistical challenges and opportunities. Southern and eastern ports such as Nansha/Guangzhou, Shanghai, and Ningbo are key to supplying Southeast Asia, Hong Kong, and Singapore. Northern ports like Qingdao and Tianjin facilitate exports to Russia and Central Asia.
Some practical recommendations derived from the data:
- Buyers: Schedule purchases taking advantage of early and late windows; use the weighted average price as a reference for cost simulations.
- Competing exporters: Prioritize differentiation through quality, certifications, and presentation to maintain higher prices compared to mass-market offerings.
- Logistics operators: Strengthen cold chain capacity, diversify ports and routes, and plan for additional capacity in atypical months to avoid losses and delays.
General data source: Agronometrics Global Trade Data — Adapted by Blueberries Consulting.
ARTÍCULOS RELACIONADOS